SCR Calculator User Manual
Version 1.17 Last modified 2025-4-6
The 'Current' Tab
In the 'Current' tab, click the Import Inputsheet (with 'Current' and 'New' tabs) button,
select the example inputsheet, and wait a few seconds for it to be imported. Then select the "Current" tab, and the following view will appear:
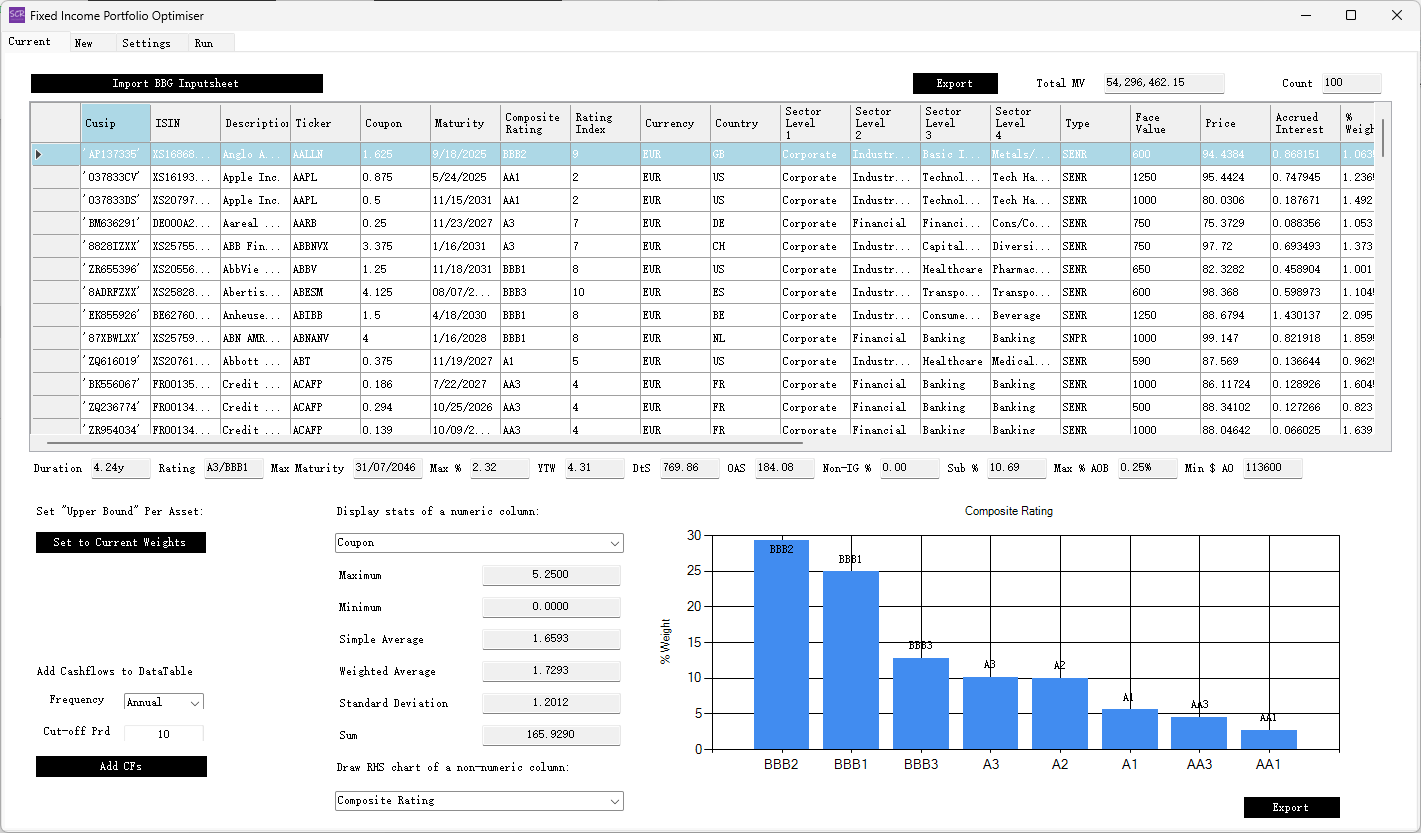
The main table mirrors the input spreadsheet with a few additional fields automatically added:
LbandUbrepresent 'Lower bound' and 'Upper bound,' respectively, for each asset. For the 'Current' portfolio,Lbis set to zero, whileUbis set to the current allocation weight. (The optimiser assumes current assets can only be sold. If you want to allow increased allocations to current assets, include them in the 'New' tab as well.)DtSrepresents 'Duration times Spread,' calculated as the product of theDuration to WorstandOAS vs Swapcolumns.Rating Indexis an integer reflecting the asset's credit rating on a notch scale:AAA=1,Aa1=2,Aa2=3,Ba3=13, and so on, withUnrated=10.5.
Below the table are read-only stats boxes, which are auto-calculated and self-explanatory:
Duration: Weighted-average duration of the portfolio.Rating: Weighted-average credit rating of the portfolio.Max Maturity: Maximum maturity of any asset in the portfolio.Max %: Maximum allocation weight of any single asset.YTW: Weighted-average Yield-to-Worst.DtS: Weighted-average Duration-times-Spread.OAS: Weighted-average Option-Adjusted Spread.Non-IG %: Percentage of non-investment-grade assets.Sub %: Percentage of subordinated assets.Max % AOB: Maximum percentage of amount outstanding bought for any single issuance.Min AO: Minimum amount outstanding for issuances in the portfolio.
To the lower left:
Set 'Upper Bound' Per Asset to Current Weights: Resets theUbcolumn to original values if modified by the user.Add Cashflows to DataTable: Enables adding projected bond-level cashflows to the datatable for optimisation. Options include selecting thefrequency(annually, quarterly, monthly) and acut-off periodafter which cashflows are excluded. This feature is particularly useful for short-term cashflow needs where optimisation is required to sell bonds while maintaining portfolio efficiency.
To the lower middle:
Display stats of a numeric column: Allows users to select a numeric column and view its statistics in six auto-updating stats boxes.Draw RHS chart of a non-numeric column: Lets users select a non-numeric column to update the right-hand-side chart, which displays distinct entries and their weights.
To the lower right is a column chart showing composition weights for the selected non-numeric column. This chart can be exported as a PowerPoint slide or an image.