SCR Calculator User Manual
Version 1.17 Last modified 2025-4-6
Menu Items in the Main Form
-
Data and Parameters
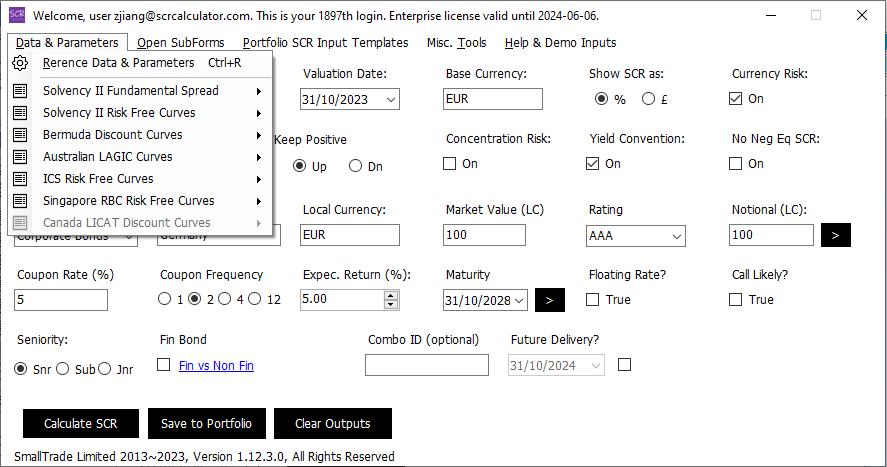
Items in this menu item include:
-
Click
Reference Data & Parameters, the following form would appear: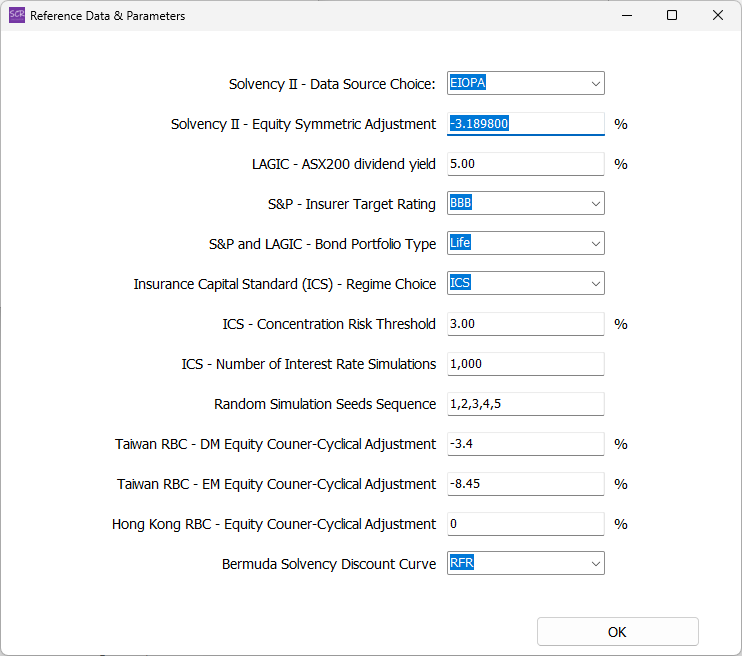
Get/set the following application-wide constant parameters:
Solvency II - Data Source choicebetween EIOPA and PRA - is explained in the "Matching Adjustment" chapter.Solvency II - Symmetric AdjustmentCurrent value of the Equity Symmetric Adjustment under Solvency II; updated monthly.LAGIC - ASX200 Dividend YieldThis determines the Australian LAGIC equity stress percentage. The higher the dividend yield, the lower the equity stress.S&P Insurer Target RatingThe higher the rating, the heavier the capital factors.S&P and LAGIC - Bond Portfolio TypeYou must choose from: life, non-life and shareholder portfolios. Each has a different set of capital charges.Insurance Capital Standard - Regime Choicebetween the ICS and its local variations - namely Korean ICS and Japan ESR.ICS - Concentration Risk Thresholddetermines the concentration risk calculation in ICS.ICS - Number of Interest Rate Simulationsself-explanatory.Random Simulation Seeds Sequencethis is a series of seeds that drive random simulations such as the ICS interest rate calculation.Taiwan RBC - DM and EM equity counter-cyclical Adjustmentssimilar to Solvency II Symmetric Adjustment, updated quarterly by the Taiwan insurance regulator, but the SCR Calculator does not maintain their values in its database. The user needs to manually enter every time.Hong Kong RBC - Equity counter-cyclical adjustmentsimilar to the Taiwan case above. The HK RBC has not been finalised, so this item defaults to zero.Bermuda Solvency Discount CurveChooses between 'RFR' and 'CORP'. The Bermuda Monetary Authority publishes two sets of curves, with the 'CORP' set incorporating an illiquidity premium. Note that what you 'get' are QUARTERLY officially published curves. The user can upload own-calibrated, more timely curves if needed.
Solvency II Fundamental SpreadThe user can get/set these parameters using the template spreadsheet provided.- ‘get’ generates a spreadsheet containing the tabs below; and ‘set’ allows you to upload such a spreadsheet (with possibly modified values and/or added rows) to customize the parameters:
- “GovFS”: government bond fundamental spreads
- “CorpFS”: corporate bond fundamental spreads
- “CorpPDprob”: corporate bond probability of default suitable for use in cashflow de-risking
- “CorpPDpct”: corporate bond probability of default expressed in absolute value (bps) terms
- “CorpCOD”: corporate bond cost of downgrade
- “GovLTAS”: government bond long-term average spread
- “CorpLTASbasic”: corporate bond long-term average spread for EUR, GBP and USD
- “CorpLTASoverEURO”: corporate bond long-term average spread for other countries
-
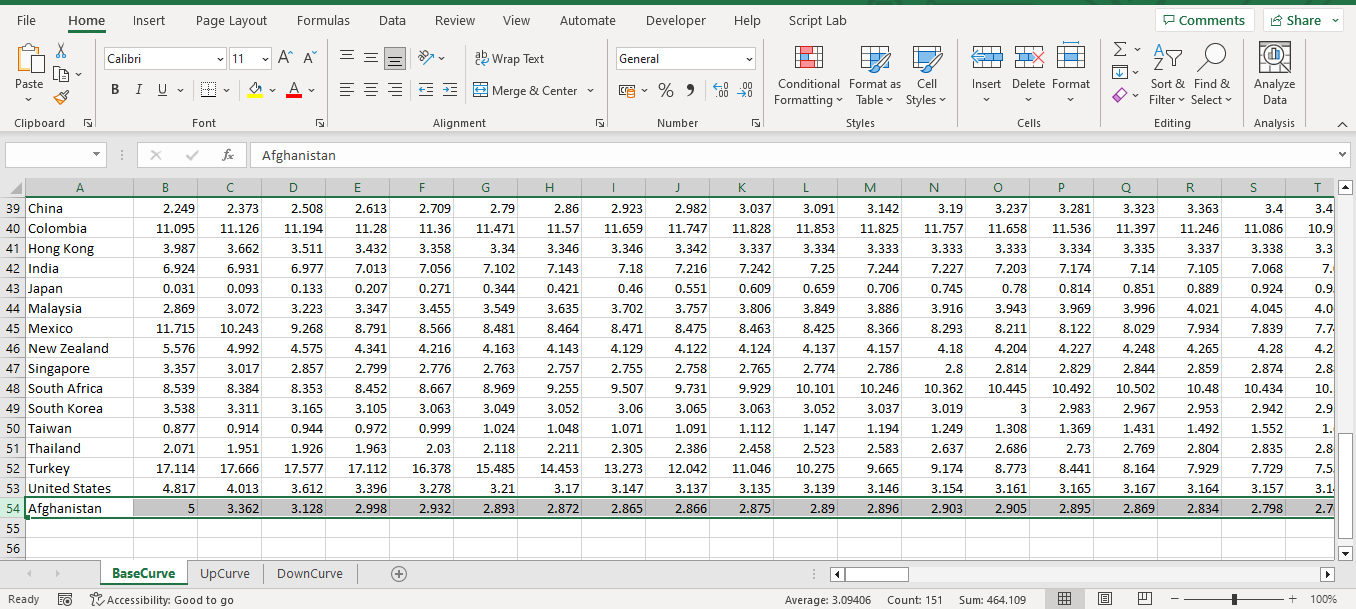
Solvency II Risk Free Curves‘Get’ generates a spreadsheet with 3 tabs - “BaseCurve”, “UpCurve” and “DownCurve”, containing curves used for interest rate SCR calculation. ‘Set’ allows you to upload such a spreadsheet (with possibly modified values and/or added rows) to customize the parameters. ‘Set Base’ allows you to update a spreadsheet containing only the “BaseCurve” tab, and the up/down stressed curves will be generated according to your supplied base curves.
If you wish to add more curves, you must modify the "BaseCurve", "UpCurve" and "DownCurve" tabs simultaneously and in a consistent format to the original. The country name you add must be of a real country; otherwise the calculator will prompt you to correct.
-
Bermuda discount curvesSimilar to the Solvency II case. -
Australian LAGIC curvesSimilar to the Solvency II case. -
ICS risk free curvesSimilar to the Solvency II case. However, what you “get” is a static set of curves as of Mar 22; and there is not a “set base” option, because the official curve stressing parameters are not disclosed yet and the Calculator cannot perform the stresses. -
Singapore RBC risk free curvesSimilar to the Solvency II case.
-
-
Open Subforms
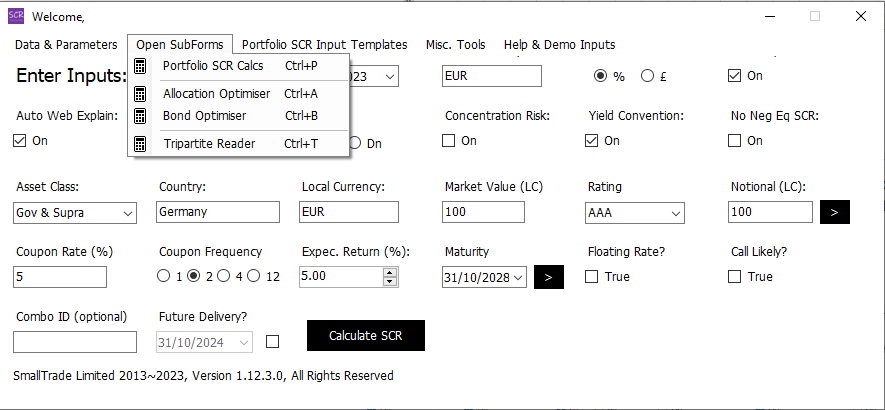
Each option under this section opens the corresponding Sub Form, which we discussed in more detail in previous chapters.
-
Input Templates → Basic/Bloomberg Inputsheets
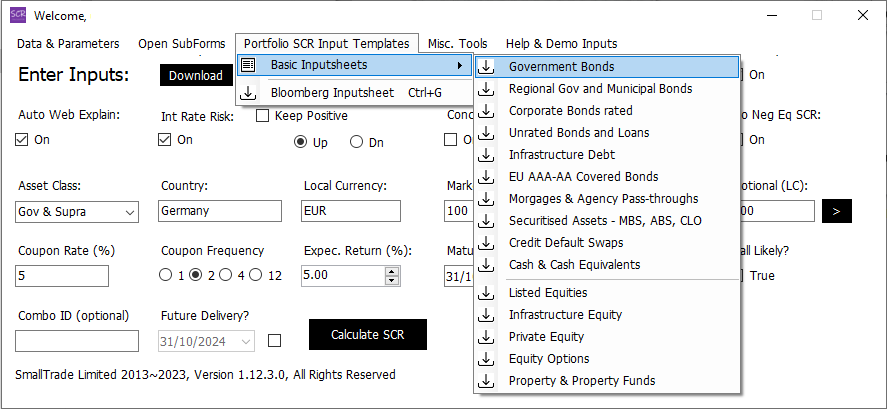
Each item is a downloadable spreadsheet. You can combine rows to form a multi-asset portfolio inputsheet.
The Bloomberg Barclays inputsheet has a distinct layout that is different from the "Basic" inputsheets and should be used separately.
-
Misc. Tools → Kill Hidden Excel
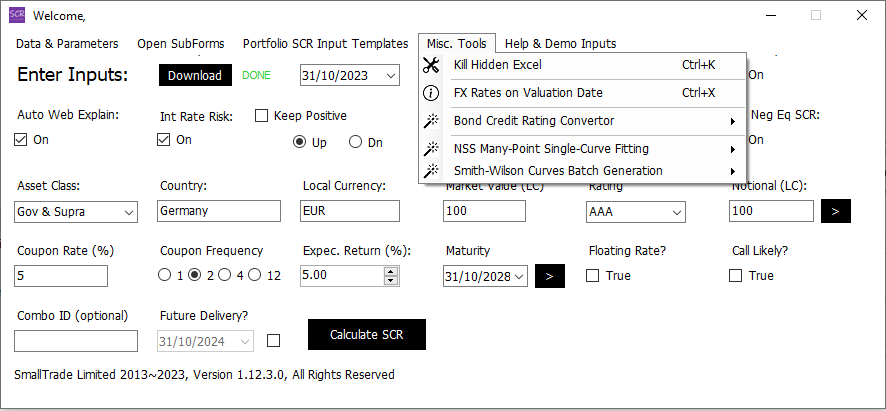
Sometimes there are hidden, read-only Excel instances that create difficultites for further processing. This button solves the problem.
-
Misc. Tools → FX Rates as of Valuation Date
The SCR Calculator's database contains daily FX rates between all EIOPA and ICS currencies since 1 Jan 2014: AUD, BGN, BRL, CAD, CHF, CLP, CNY, COP, CZK, DKK, EUR, GBP, HKD, HUF, IDR, ILS, INR, ISK, JPY, KRW, MXN, MYR, NOK, NZD, PEN, PHP, PLN, RON, RUB, SAR, SEK, SGD, THB, TRY, TWD, USD, ZAR.
These FX rates are useful when you work with a multi-currency portfolio. The calculator can convert between local currency and portfolio currency market values of the assets behind the scene; You do not need to manually look up FX rates, unless it is not among the above currencies, in which case the SCR Calculator will prompt for your input. The local currency values are useful for cashflow projection. The portfolio currency values are useful for calibrating weights and total SCR. This menu button is provided for reference, such that you have transparency what FX rates are being used.
-
Misc. Tools → Bond Credit Rating Convertor
Solvency II and a few other regimes require the use of the "second best" rating out of 3 major rating agencies' ratings. This facility is provided for users to conveniently derive such ratings. Click the "Download Template" button and obtain the spreadsheet like following:
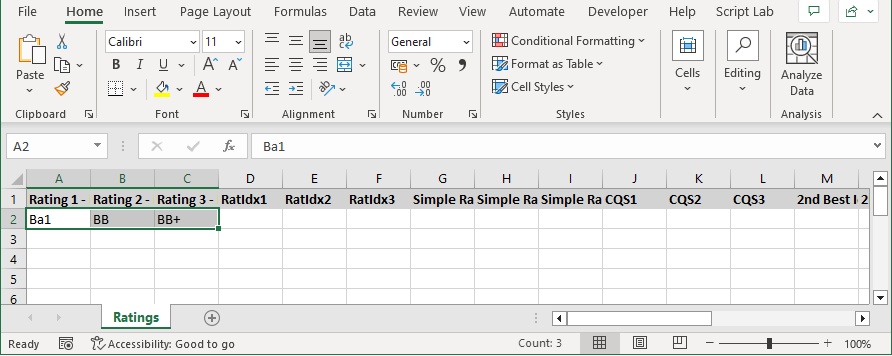
In the first three columns, you need to fill in the three ratings from your chosen rating agencies. The SCR calculator can digest a wide range of input rating formats. The example screenshot has one row but you can fill in multiple rows of course. Then use the "Upload & Process" button, the calculator will give you a new spreadsheet containing a range of ratings outputs such as below
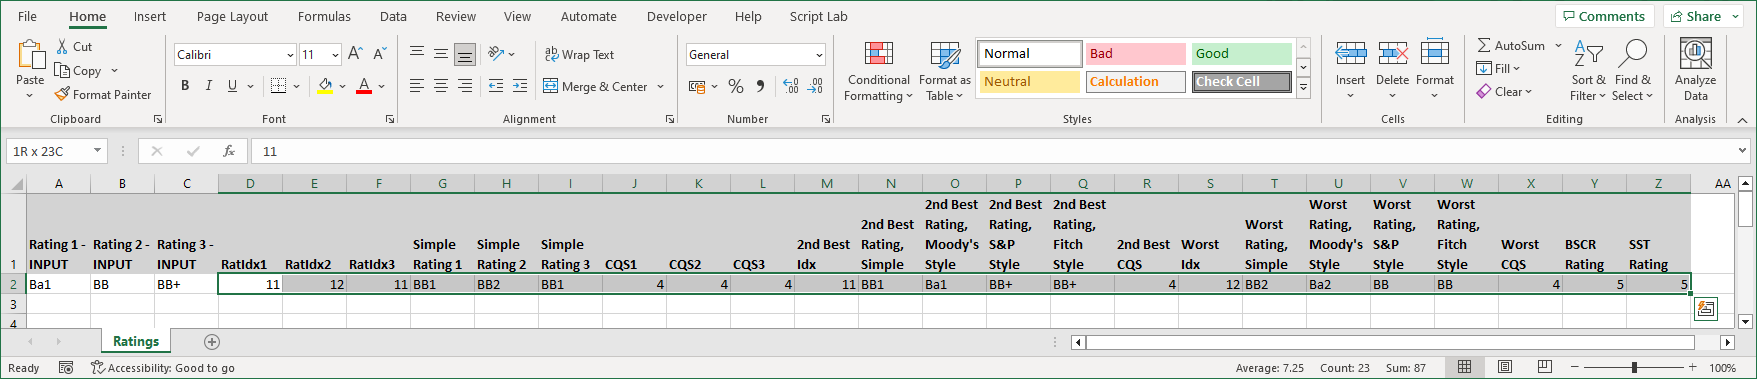
- Rating Index is a numerical index representing notch-level average credit quality of the portfolio: 1=Aaa, 2=Aa1, 3=Aa2, 4=Aa3, 5=A1, 6=A2, 7=A3, 8=Baa1, 9=Baa2, 10=Baa3, 11=Ba1, 12=Ba2, 13=Ba3, etc. The "RatIdx1","RatIdx2", "RatIdx3" columns are these index values corresponding to your inputs.
- Simple Rating means ratings such as these: "AAA", "AA1", "AA2", "AA3", "A1", "A2", "A3", "BBB1", "BBB2", "BBB3", "BB1", "BB2", "BB3", "B1", "B2", "B3", "CCC1", "CCC2", "CCC3", "CC1", "CC2", "CC3", "C", "D". These are the preferred rating format used by the SCR Calculator during portfolio data import.
- CQS means "Credit Quality Step". Their values range from 0 (AAA), 1 (AA), 2 (A), 3 (BBB), 4 (BB), 5 (B) and 6 (CCC and below). These are the EIOPA-defined rating grades used to calculate spread SCR.
- Second Best and Worst columns are self-explanatory.
- BSCR Rating is 0-8. 0 is for AAA-AA government bonds. 1 (AAA), 2 (AA), 3 (A), 4 (BBB), 5 (BB) , 6 (B) , 7 (CCC) and 8 (below and non-rated).
- SST Rating is the Swiss Solvency rating mapping and is defined similarly to BSCR Rating.
-
Misc. Tools → NSS Many-Point Single-Curve Fitting
This is a tool for fitting a Nelson-Siegal-Svensson curve out of many curve data points.
- Download the template and fill the “Input” tab with your own curve points data.
- In the “Fitted” tab, enter the tenors for which you wish to obtain the fitted curve points.
- Upload the template. It will be regenerated for you with the Nelson-Siegal-Svensson parameters populated and the fitted curve points populated.
-
Misc. Tools → Smith-Wilson Batch Curve Generation
This is a convenient tool where you can generate a large number of Solvency II-compliant curves using the Smith-Wilson algorithm
- Download the template and fill in the “Params” tab with Smith-Wilson parameters. The table column names must correspond to the rest tab names.
- Each of the rest tabs contains a set of curves with the same tenor data.
- Upload the template and a complete set of Smith-Wilson interpolated/extrapolated curves each with 150 years of length will be generated.
-
Help & Demo Inputs → Download Demo Inputs
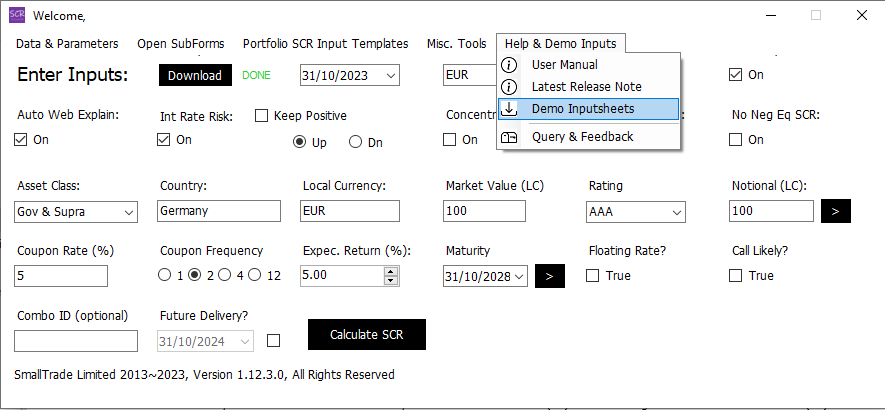
Offers downloadable input spreadsheet samples for each of the subforms.