SCR Calculator User Manual
Version 1.17 Last modified 2025-4-6
Annuity Cashflow Matching
Cashflow Optimisation for Long-Duration, Annuity Cashflow Matching
Long-duration cashflow matching, such as for 20+ year annuity cashflows, follows the same process as standard optimisation, with additional considerations such as de-risking.
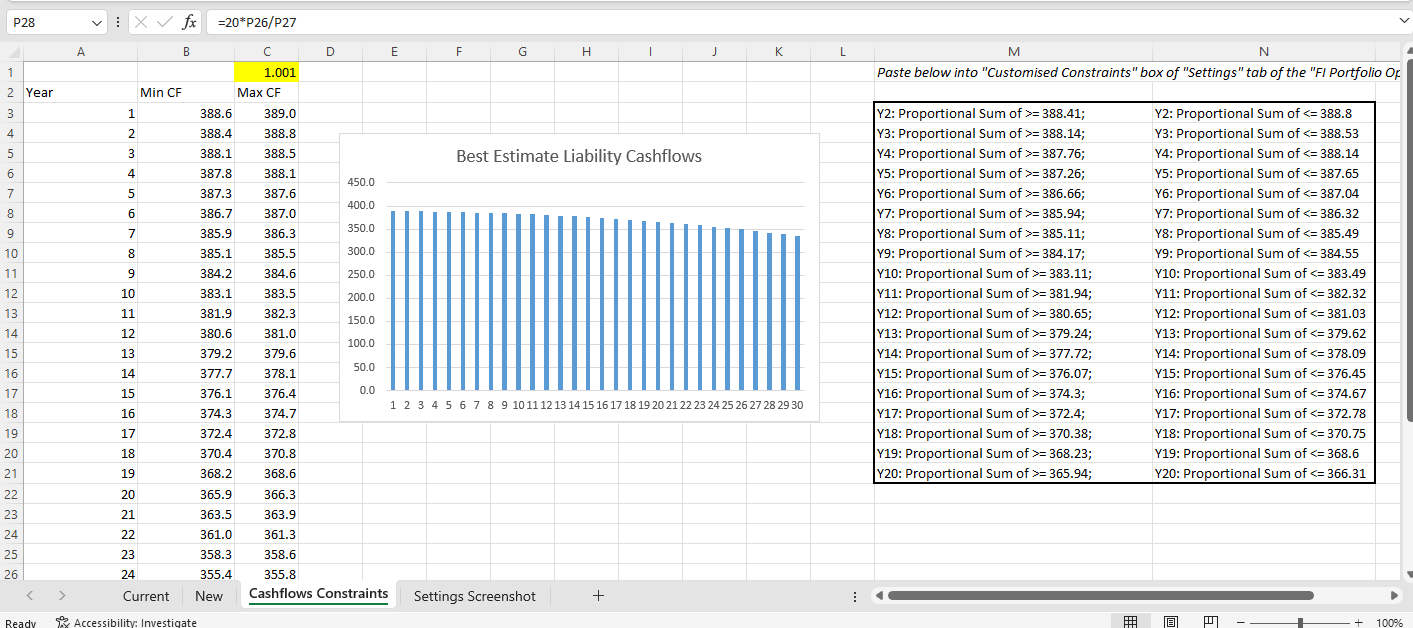
Target cashflow constraints can be saved in a spreadsheet (a downloadable example is provided below) for convenient copy-pasting into the 'Optimised Constraint' box of the calculator:
While actual annuity cashflows may extend beyond 40 years, this example uses liquid bond assets with an average duration of approximately 15 years. For demonstration purposes, we match only 20 years of cashflows. For longer-duration cashflows, a broader asset space with longer durations is required.
Step 1: Probability of Default Data Generation
Proper matching-adjustment-compatible annuity cashflow optimisation requires de-risking cashflows using Probability of Default (PD) data from EIOPA or the PRA. These data are stored in the SCR Calculator database and are readily available for use. The steps are outlined below.
First, prepare the current portfolio and the investible universe of bonds in the "Current" and "New" worksheets, respectively.
If constructing a portfolio from scratch, place one nominal bond in the "Current" worksheet (as shown in the downloadable example) to satisfy optimiser requirements. For portfolio rebalancing, include the complete actual holdings in the "Current" worksheet.
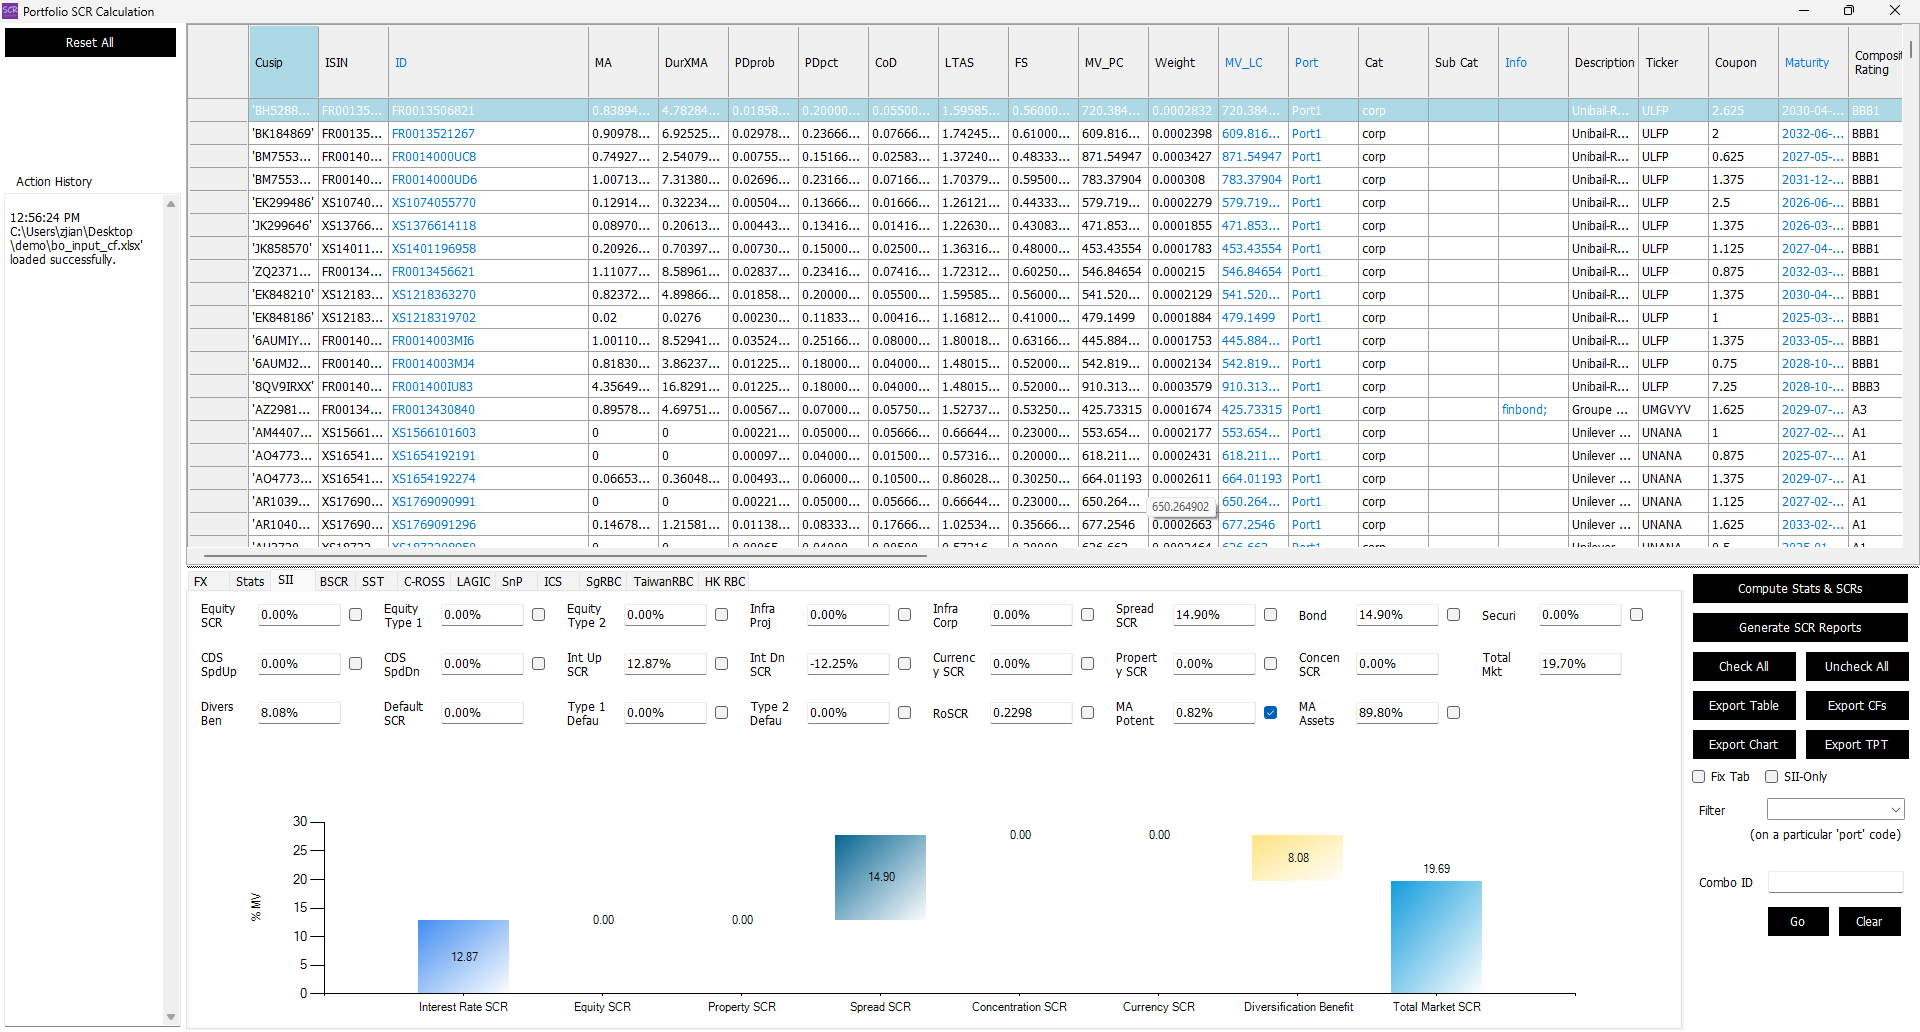
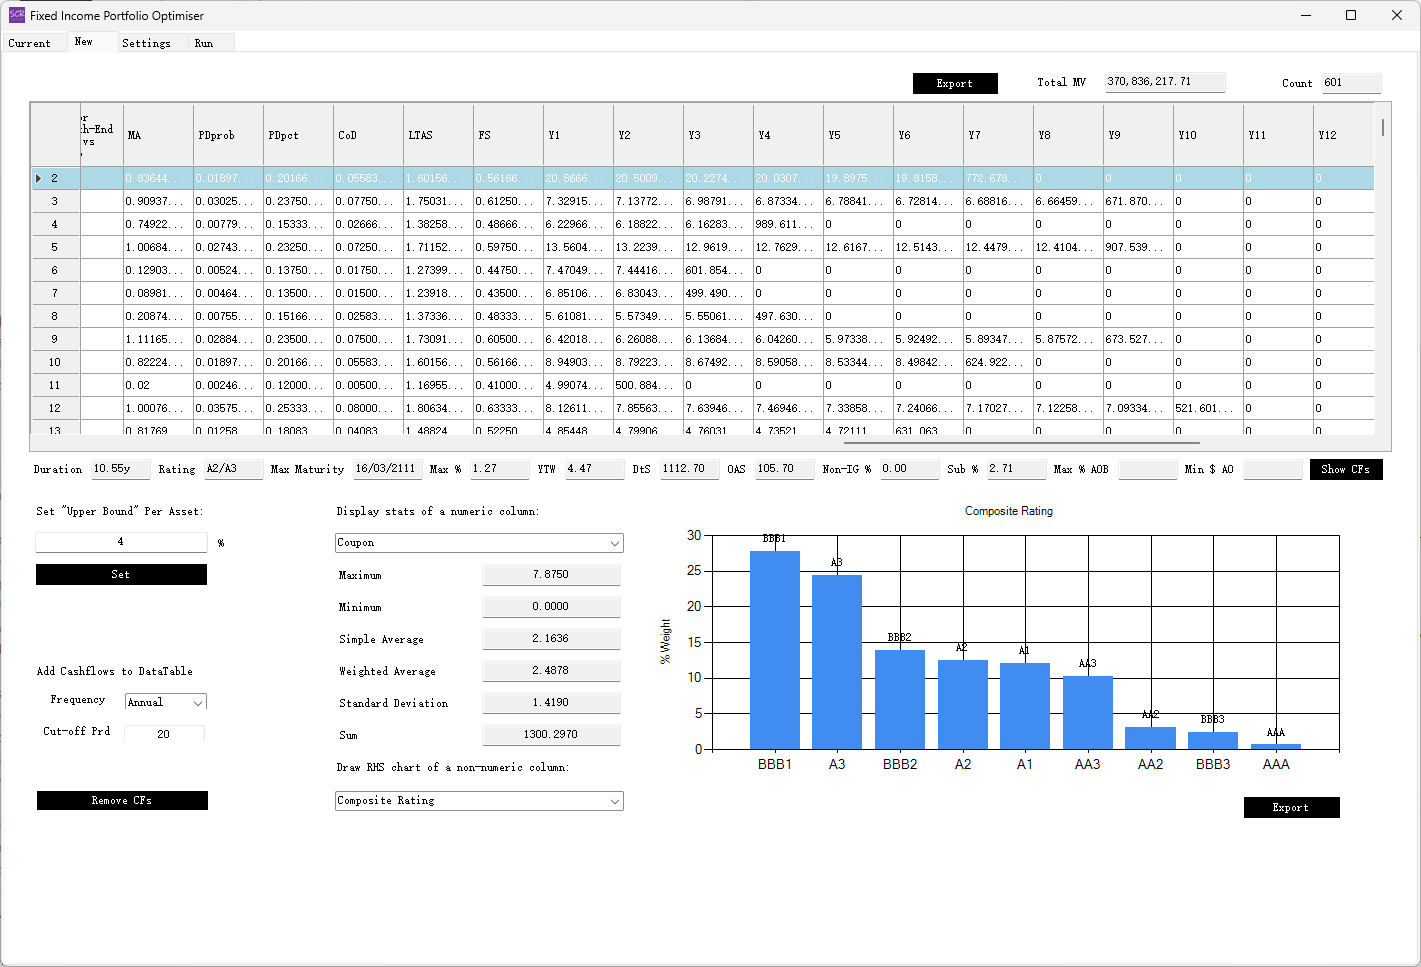
Upload the example spreadsheet into the "Portfolio SCR" form (select Bloomberg input mode) twice, selecting "Current" and "New" worksheets in turn. Then, tick the "MA Potent" checkbox in the "SII" tab for both worksheets. The system will calibrate and add MA-related columns to the beginning of the data table, as shown below:
Export the data table and copy/paste the MA-related columns into the inputsheet, appending them to the corresponding tabs. A revised downloadable example is available below:
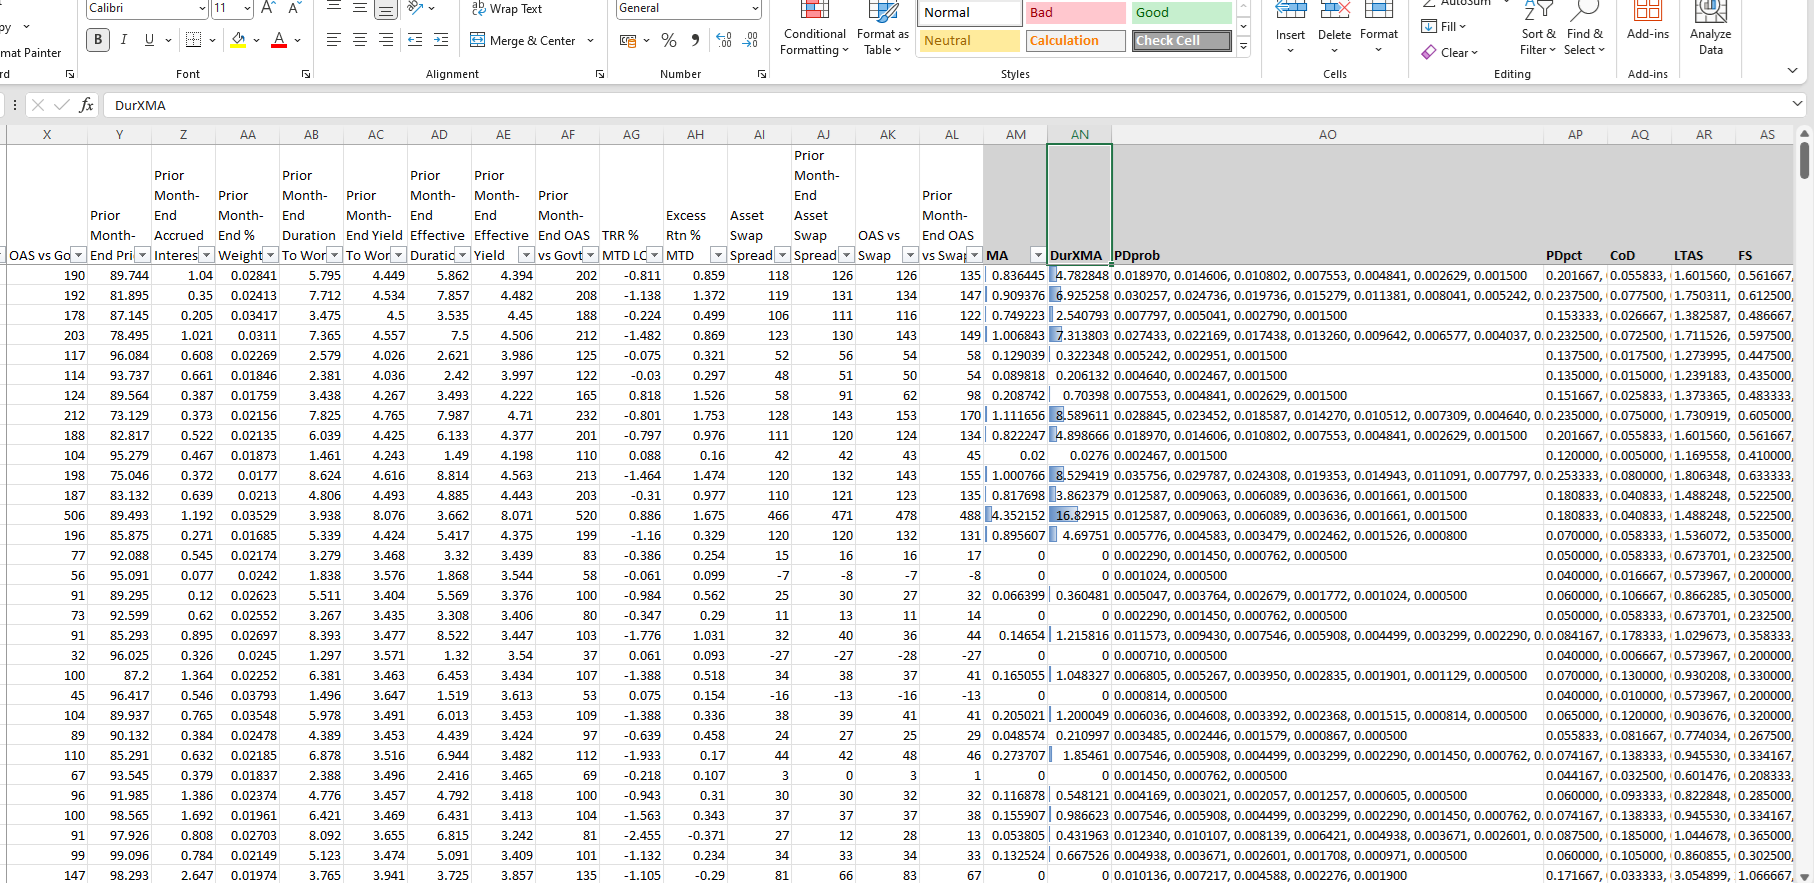
Key columns include:
DurXMA: Represents Duration Times Matching Adjustment, used as the optimisation objective.PDprob: Indicates Probability of Default for each year of the bond's remaining life, presented in a comma-separated format. This column is auto-recognised by the Fixed Income Portfolio Optimiser for cashflow de-risking.
Note: These columns are generated only for MA-compatible assets. To de-risk all fixed income cashflows, manual adjustments may be required.
Step 2: Generate Cashflows for Optimisation
Upload the revised inputsheet into the Fixed Income Portfolio Optimiser.
In both the "Current" and "New" tabs, click the Add CFs button to generate 20 years of cashflows (Y1, Y2, ..., Y20 columns).
You will be prompted to confirm whether to use the PDprob column for cashflow de-risking. Select "Yes."
(If the column is absent, you will be asked to confirm that no de-risking is required.)
Note that the cashflow projections assume semi-annual coupons throughout. This is a simplification compared to the Portfolio SCR form, which assumes daily cashflow modelling.
Step 3: Optimisation Settings
Enter the following settings in the "Settings" tab:
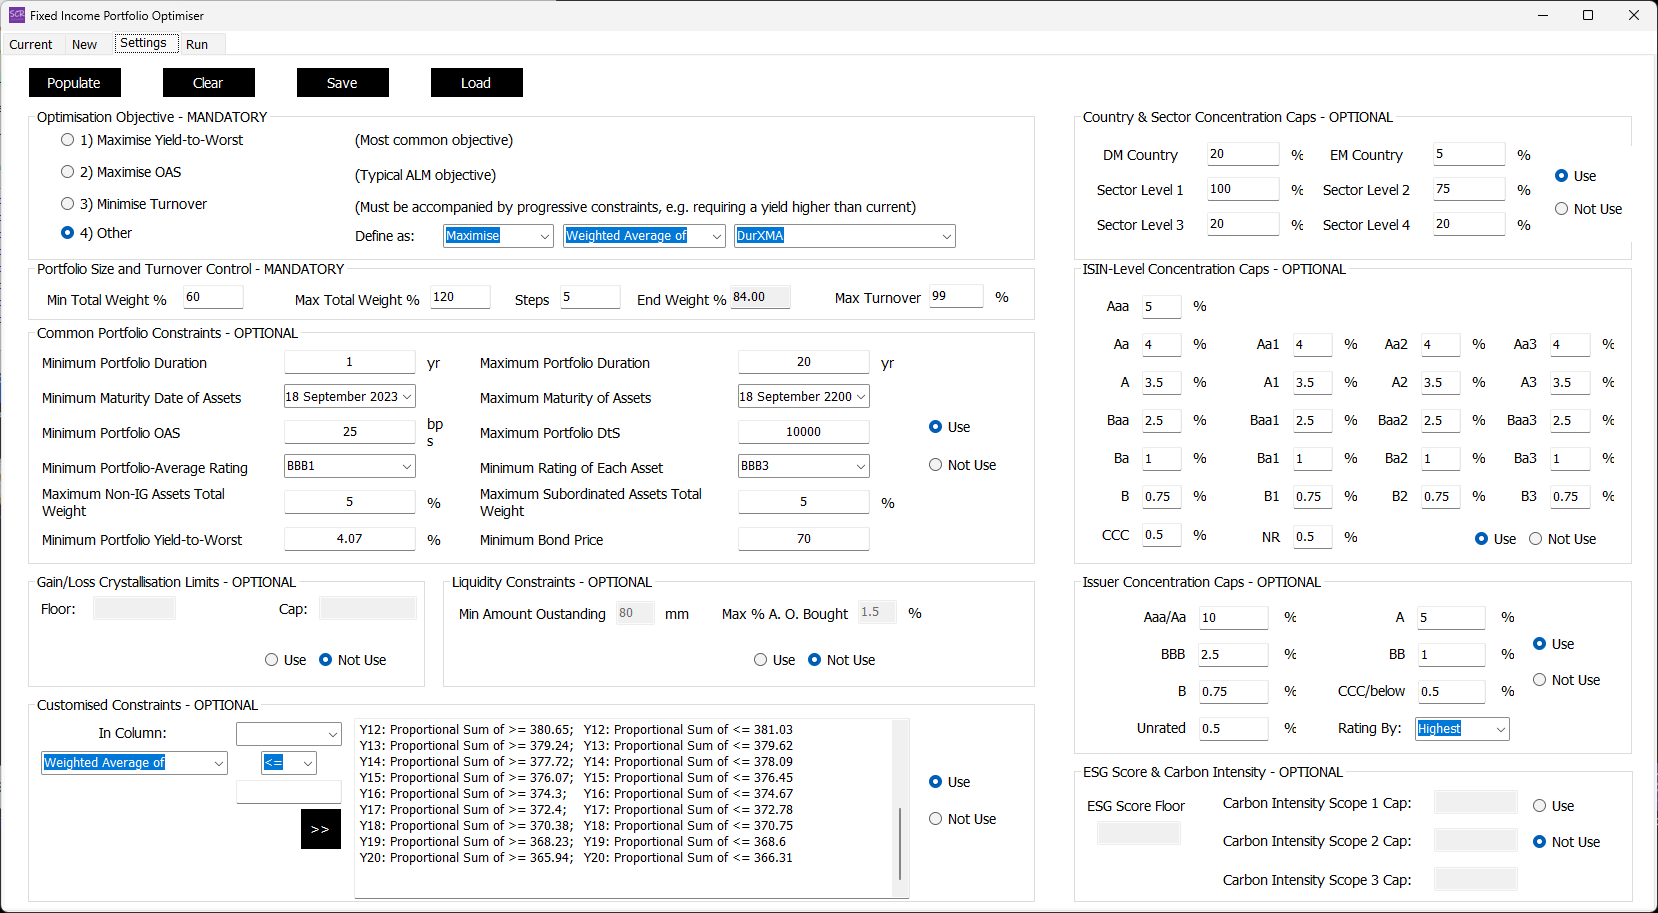
Key settings include:
- Objective: Maximise
DurXMA(Duration Times Matching Adjustment). - Portfolio Size: Allow the optimiser to search for a minimum portfolio size between 60% and 120% to meet cashflow requirements.
- Constraints: Start with loose constraints to prioritise cashflow matching.
- Cashflow Constraints: Copy/paste constraints directly from the input spreadsheet.
- Unused Sections: Turn off unused sections, such as gain/loss crystallisation, liquidity constraints, and ESG score.
Begin with loose constraints and gradually tighten them to ensure a feasible optimised portfolio. Adjust "Upper Bound" settings in the "Current" and "New" tabs if they risk becoming bottlenecks.
Final Step: Optimisation
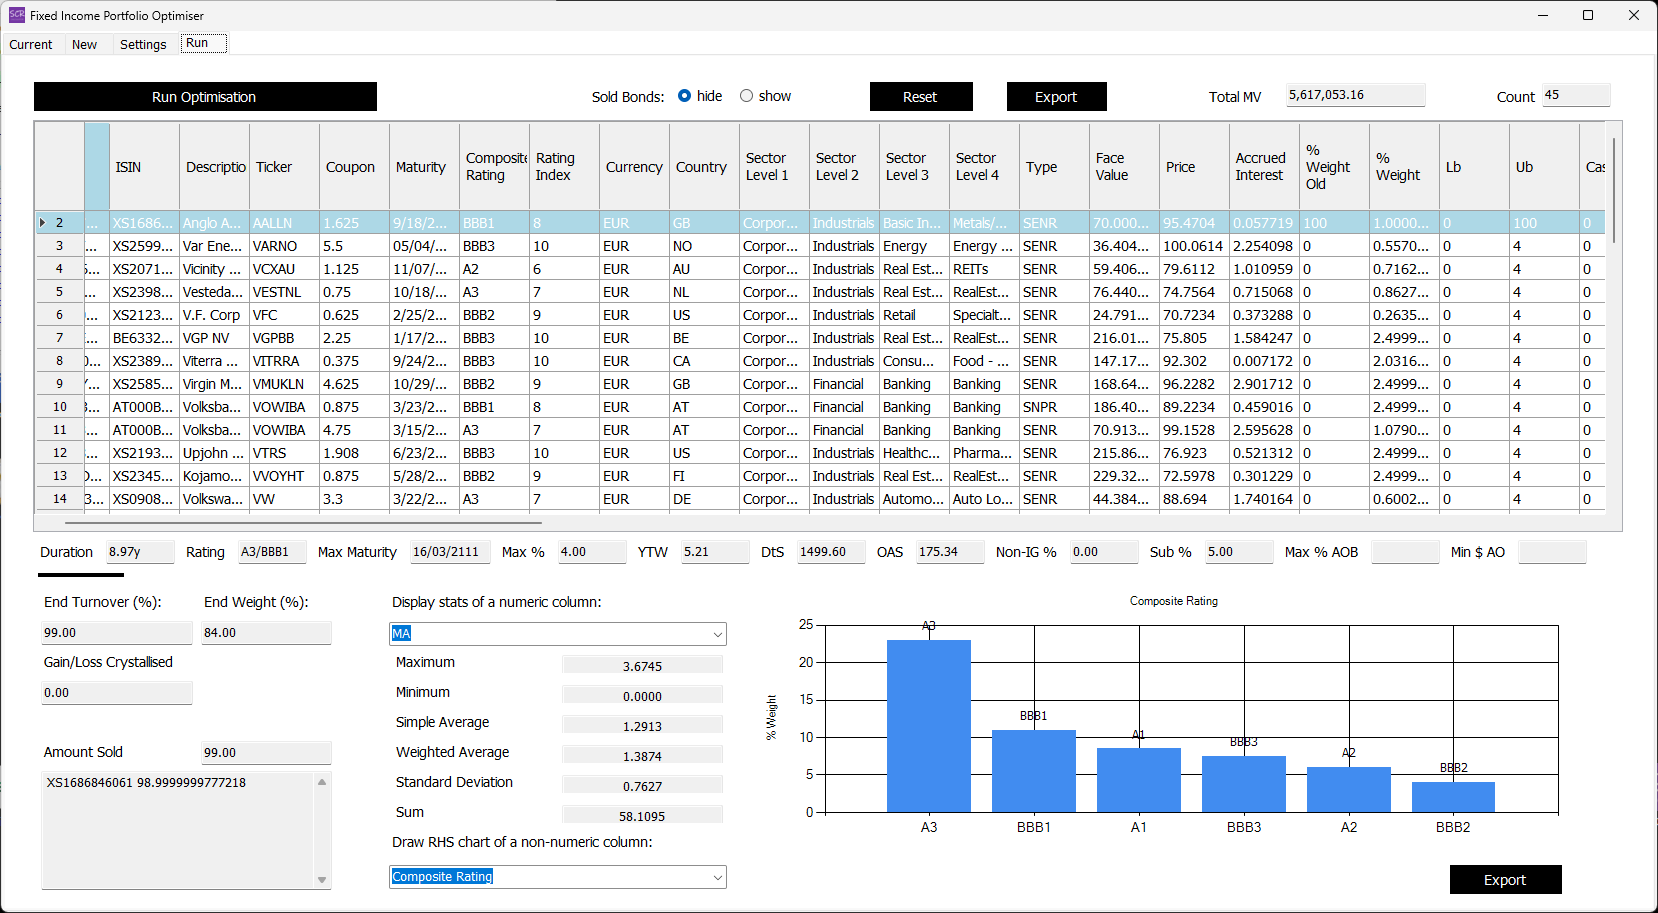
Navigate to the "Run" tab and click Run Optimisation.
The optimised portfolio will include approximately 44 bonds. Click the Show CFs button to display a well-matched cashflow series:
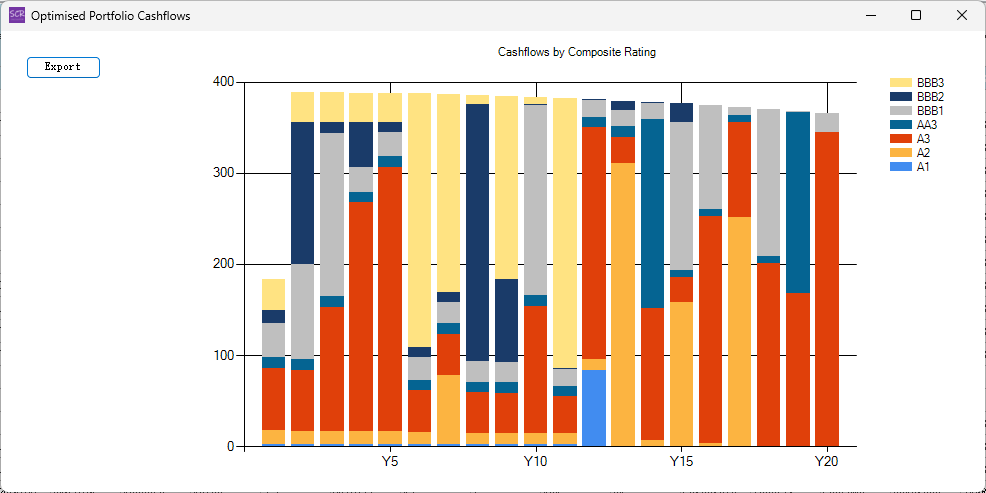
The composition of the cashflows can be adjusted using the Combo Box under the "Draw RHS chart of a non-numeric column" label.
Additionally, you can evaluate the optimised Matching Adjustment by using the numeric column display feature to show the "Weighted Average":