SCR Calculator User Manual
Version 1.17 Last modified 2025-4-6
Singapore RBC - Implementation Technicals
Unique Characteristics of Singapore RBC as Compared to Solvency II
The Singapore RBC regime is very similar to Solvency II. This is not surprising given the fact that the Singaporean actuarial system originated from the UK.
Several differences arise mainly due to the relatively simple nature of Singapore RBC compared to Solvency II:
- Singapore RBC interest rate base curves, where available, have slightly different LLPs and UFRs from those of Solvency II. See table below for a complete comparison:
Table by SCR Calculator, SmallTrade Limited. All Rights Reserved.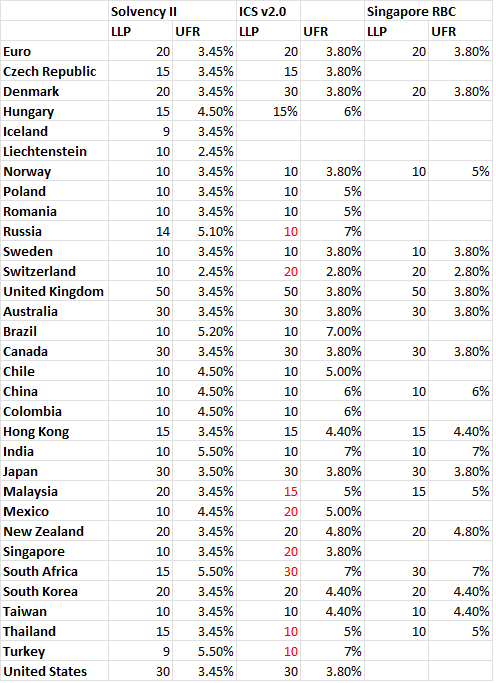
- Interest rate stresses are subject to a maximum 200bps shock either way. This leads to noticeable differences from Solvency II given today's relatively high interest rates in DM countries.
- Singapore matching adjustment portfolio only accepts USD and SGD liabilities.
- There is no favourable capital relief for infrastructure assets.
- Currency risk, at 12%, is considerably lighter than under Solvency II.
- There is no concentration risk module in the market risk aggregation.
- Credit spread risk for all credit assets (apart from A-and-above govies) are obtained through a spread-widening stress, unlike solvency II which simply uses a charge matrix.
- There is no equity symmetric adjustment for equities under Singapore RBC.
- REITs have their own risk capital category, and the charge is heavier than that of properties and same as EM equities.
The above points, where relevant, are all reflected in the SCR Calculator's implementation.
Single Asset Risk CapitalSingle Asset risk capital calculation is well-explained using the "Explain this Calculation" button.
Portfolio Interest Rate Risk AggregationBase yield curves are just the Solvency II base curves, because the UFRs and LLPs are similar between the two.
Correlation MatrixSingapore RBC market risk correlation matrix is as below: